Mercury in tuna: why limit it, and how many cans to eat
Mercury in canned tuna: data from 148 cans and a new study by your weight and your genetics (GSTM1, GSTP1 and GPX1). You will want to read it.
Mercury builds up in large fish and, according to AESAN, it can affect the developing central nervous system: that is why it helps to know how many cans of tuna fit into your week. An analysis by BLOOM and foodwatch (two non-governmental organisations) measured the mercury in 148 cans of tuna bought in five countries in 2024, and every one contained some. Nutrigenomics adds a clue: the genes GSTM1, GSTT1, GSTP1 and GPX1 take part in how your body clears methylmercury, which is why we give an estimate of cans by genotype.
You can eat canned tuna every week, and your genotype can help you fine-tune how many cans. As a starting point, a CESGEN estimate: about 2 cans of light tuna a week if you weigh around 60 kg and 2 to 3 if you weigh 70 kg or more, with cans of medium content (around 0.5 mg/kg of mercury) and the rest of the fish small and varied (sardines, anchovies, mackerel). If you carry the GSTM1 or GSTT1 deletion, the estimate drops to about 2 cans, and to 1 or 2 if you carry both. These are CESGEN estimates, guides and approximations, calculated from the EFSA tolerable weekly intake of methylmercury; they are not EFSA or AESAN figures, nor the result of a validated clinical study. The sum is set out step by step below so you can adjust it to your weight.
Mercury is not a fixed number
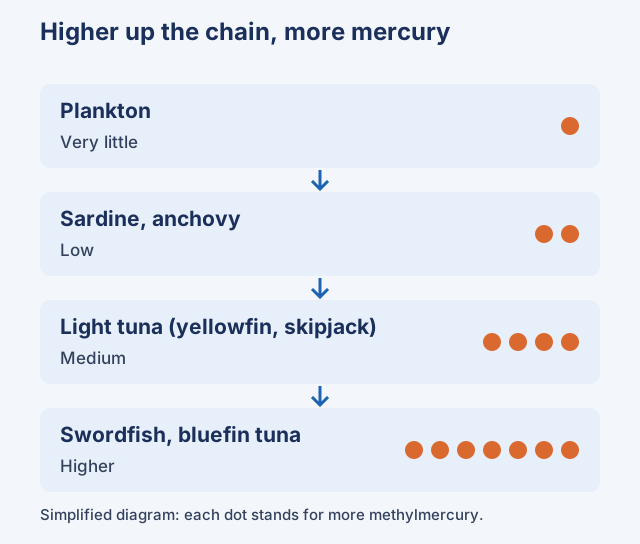
Mercury reaches fish and, as methylmercury, builds up as you move up the food chain: a small fish feeding on plankton collects little, while a large, long-lived predator collects far more. That is why the Spanish food agency AESAN lists swordfish, bluefin tuna (Thunnus thynnus), sharks (dogfish, mako, smooth-hound and others) and pike as high in mercury, and places sardines, anchovies, mackerel, salmon, hake and cod, among others, in the low group (AESAN, 2019). Species that appear on neither list, including the other tunas, count as medium.
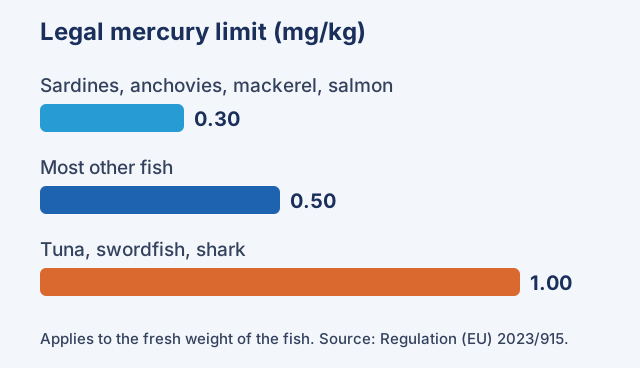
European law sets different limits by fish, referring to the fresh weight of the fish: 1.0 mg/kg for tuna, swordfish and shark; 0.30 mg/kg for sardines, anchovies, mackerel, salmon, trout, cod and herring, among others; and 0.50 mg/kg for all other fish (Regulation (EU) 2023/915). These are limits for fresh fish: they should not be read as a direct limit for the can.
Within one species the spread is wide. In 2024 the organisations BLOOM and foodwatch analysed 148 cans of tuna bought at random in Germany, the United Kingdom, Spain, France and Italy: every can contained mercury, the median was 0.36 mg/kg, 57% exceeded 0.3 mg/kg, roughly one in ten exceeded 1.0 mg/kg, and the highest reached 3.9 mg/kg; on average, 90% of the mercury in the cans was methylmercury (BLOOM, 2024). This is a report from a non-governmental organisation, not a peer-reviewed paper, and authorities and industry dispute its conclusions; we use it as a sign that content varies a great deal from can to can, not as a measurement of your can.
How to work out an estimate of cans
In 2012 EFSA set a tolerable weekly intake of methylmercury of 1.3 µg per kg of body weight, expressed as mercury. It is an average of long-term exposure: a single excess does not amount to keeping up a high intake week after week, and it does not guarantee that there is no risk either; what is watched is the habit (EFSA, 2012). A simple sum follows from it.
The weekly ceiling is 1.3 × your weight in kilograms. A can of tuna contributes the drained portion (here, 55 g) multiplied by its mercury content. Since you do not know the mercury in the can in your hand, the sum uses scenarios of content, not a figure for your can. It also treats total mercury as if it were all methylmercury, a cautious assumption, because in the BLOOM cans methylmercury was, on average, 90%.
At 70 kg the ceiling is 91 µg a week. A 55 g portion in the 0.3 mg/kg scenario gives 16.5 µg, so 5.5 cans would fit if they were the only fish in your week. In the 0.5 mg/kg scenario, 3.3 cans. In the 1.0 mg/kg scenario, 1.7.
| Scenario for the content of the can (total mercury) | 60 kg | 70 kg | 80 kg |
|---|---|---|---|
| 0.3 mg/kg (close to the BLOOM median, 0.36) | 4.7 | 5.5 | 6.3 |
| 0.5 mg/kg | 2.8 | 3.3 | 3.8 |
| 1.0 mg/kg (the legal limit for fresh tuna, used here as a scenario for the can) | 1.4 | 1.7 | 1.9 |
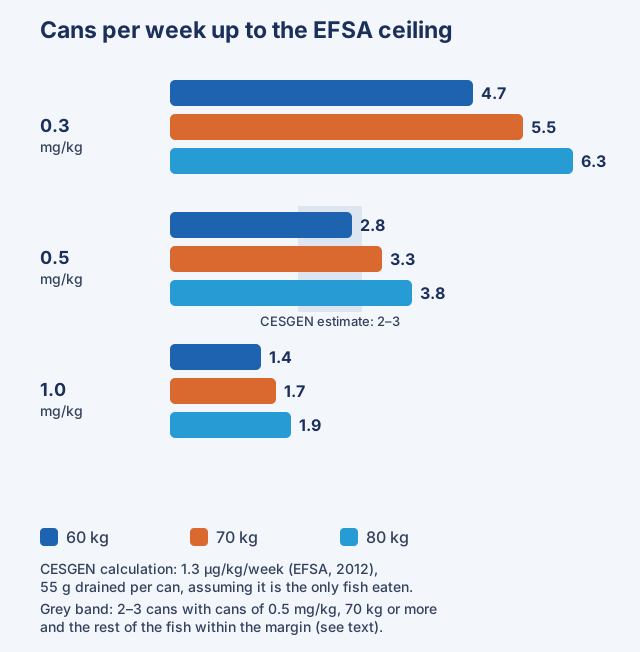
From this comes the starting estimate: about 2 cans of light tuna a week at 60 kg, and 2 to 3 from 70 kg, for a healthy adult with cans of medium content. The rest of the week's fish still has to be counted, and that is the nuance. At 70 kg with cans in the 0.5 mg/kg scenario, 2 cans contribute 55 µg of the 91 µg ceiling, leaving 36 µg. If the rest of your fish were of low content, about 0.1 mg/kg (our assumption, illustrative and not a measured figure), those 36 µg would cover about 360 g of fish, almost three portions of 125 g; if it were at the legal maximum for small fish, 0.30 mg/kg, they would cover about 120 g, one portion. At 60 kg, with 2 cans, 23 µg remain: about 230 g at 0.1 mg/kg or about 77 g at 0.30 mg/kg. With 3 cans at 70 kg only 8.5 µg remain, about 85 g at 0.1 mg/kg or 28 g at 0.30 mg/kg, and at 60 kg the ceiling is already exceeded. That is why we keep 3 cans for weeks when the rest of your fish is small in quantity or of very low content; otherwise, 2 cans. If your cans were in the 1.0 mg/kg scenario, the estimate would be 1 can. If your can states a drained weight other than 55 g, the sum changes in proportion. This is arithmetic on the EFSA figure, not an official limit.
For the rest of the week, AESAN recommends 3 or 4 portions of fish, alternating white and oily fish (AESAN, 2019). A pattern that fits both: one or two portions of small oily fish (sardines, anchovies, mackerel), one of white fish, and canned tuna as an extra.
Pregnancy, breastfeeding and planning a pregnancy, and children up to 10 years old, follow a different AESAN guide: avoid the high-mercury species (swordfish, shark, bluefin tuna and pike) and keep eating low and medium species, 3 or 4 portions a week. Between 10 and 14 years, limit those species to 120 g a month (AESAN, 2019). The estimates in this entry are for healthy adults outside those situations.
Genes and mercury: what the evidence says
Your genotype can help you fine-tune the estimate. Your body clears methylmercury by binding it to glutathione, and the glutathione S-transferases (GSTs) take part in that binding. Two of these genes can be missing altogether: GSTM1 and GSTT1 each have a deletion in which the enzyme is not made (the "null" genotype). Two missing copies of GSTT1 appeared in 20% of a sample of 180 people of European ancestry (Sprenger et al., 2000). GSTP1 has a common variant, rs1695, that changes one amino acid in the part of the enzyme that recognises its substrates (isoleucine to valine at position 105) and alters its stability and activity depending on the compound (Johansson et al., 1998). GPX1 (rs1050450) makes a selenium-containing enzyme.
How sure are we? The biochemical effect of GSTP1 on the enzyme is well established; that these genes change how much mercury a person accumulates after eating fish is not. A 2015 review concluded that results were contradictory for most genes and that no candidate gene had shown a major effect on the kinetics or toxicity of mercury, perhaps because it is a polygenic trait (Llop et al., 2015). The studies measured mercury in blood, plasma or hair; none tested a number of cans by genotype.
The numbers of cans in the table are a CESGEN estimate, guide and approximation, and not the result of a validated clinical study: no study tested a number of cans by genotype. They assume an adult of 70 kg or more, cans of medium content and the rest of the week's fish of low content; for another weight, another content or more fish, recalculate with the sum above. Use them as a starting point to try and observe.
From the sum to each number. We start from the 2–3 cans range given by the sum by weight and apply cautious rules. They are a CESGEN judgement, not the result of any study. General rule: if any study links the genotype with more mercury, we take the lower end of the range, about 2 cans; this applies to GSTM1 null and, for GSTP1, to isoleucine carriers (A/A and A/G), because the two studies that looked at how fish relates to mercury point to more mercury in them (Zaman et al., 2024; Schläwicke Engström et al., 2008). For the combination with the clearest signal, GSTM1 and GSTT1 both null, we go one step lower, to 1–2. There are two exceptions, and we state them plainly. GSTT1 null on its own gets 2 by cautious analogy with GSTM1: the signal of more mercury is that of the double null, not of GSTT1 alone. GSTP1 G/G keeps the full range, 2–3, because the signal of more mercury with the G allele in Chan et al. (2020) comes from carriers grouped together (A/G and G/G against A/A), not from G/G, and it disagrees with the studies that looked at the relationship with fish. In the rows with no signal of more mercury (GSTM1 present and GPX1) the full range of 2–3 is kept.
| Your genotype | What has been observed | Cans a week (CESGEN estimate) | What you can do | Evidence |
|---|---|---|---|---|
| GSTM1 present (one or two copies) | In an Amazonian population eating a lot of fish, people with GSTM1 accumulated less mercury in plasma than null carriers (de Oliveira et al., 2014); in 149 women in a city with low exposure there was no difference (Rocha et al., 2016). | 2–3 | Apply the starting estimate and fill the rest of the week with small oily fish. Having GSTM1 does not mean you can stretch it: it depends on your weight and the content of the can. | Exploratory, not actionable |
| GSTM1 null (deleted on both copies) | In 88 people with a high fish intake, null carriers had more total mercury and more methylmercury in plasma (de Oliveira et al., 2014). It is a high-exposure study, from the same group as the Mazzaron Barcelos et al. (2012) one. | About 2 | Stay at the cautious end: about 2 cans, with sardines, anchovies and mackerel as the main fish of the week. There is no need to measure mercury because of this genotype. | Exploratory, not actionable |
| GSTT1 null (deleted on both copies) | In the Amazonian population, GSTT1 carriers had lower mercury in blood and hair than other genotypes (Mazzaron Barcelos et al., 2012), but the explicit finding of more mercury was in the double null, not in GSTT1 null alone. In Michigan dentists, the deletion was associated with urinary mercury, a marker of elemental mercury rather than of fish (Goodrich et al., 2011). | About 2 | The 2 cans are a cautious CESGEN choice by analogy with GSTM1, not a direct result of those studies. Prioritise small oily fish. | Exploratory, not actionable |
| GSTM1 and GSTT1 both null | In 144 people, those null for both genes had more mercury in blood and hair than the rest (Mazzaron Barcelos et al., 2012). | 1–2 | This is the combination with the clearest signal in that high-exposure study: the cautious choice is 1 or 2 cans, more variety of species, and small oily fish as the base. | Exploratory, not actionable |
| GSTP1 rs1695, A/A (Ile/Ile) | The direction is not the same across studies. In Jamaican children, eating canned sardines and mackerel (not tuna) was associated with more blood mercury in Ile/Ile and Ile/Val (Zaman et al., 2024); in mothers in Hong Kong, the minor allele G was associated with more hair mercury (Chan et al., 2020). | 2 | Stay at 2 cans, without going to the top end of the range. Note for a month how many cans and which other fish you eat, and check that large fish do not creep in every week. | Exploratory, not actionable |
| GSTP1 rs1695, A/G (Ile/Val) | As above: in the Jamaican cohort, more blood mercury with canned sardines and mackerel (Zaman et al., 2024). In 292 people in northern Sweden with a high fish intake, the relationship between fish eaten and red-cell mercury was steeper with 0 or 1 variant allele (adding positions 105 and 114) than with 2 or more (Schläwicke Engström et al., 2008). | 2 | Stay at 2 cans, with tuna as an extra and variety of species as the priority. | Exploratory, not actionable |
| GSTP1 rs1695, G/G (Val/Val) | With two copies of the G allele the cohorts do not agree either: more hair mercury in the Hong Kong mothers, no increase with canned sardines and mackerel in the Jamaican children. | 2–3 | Starting estimate. The genotype does not justify a different figure; stay with what is known: vary the species and do not repeat large fish. | Exploratory, not actionable |
| GPX1 rs1050450, C/C (Pro/Pro; G/G in the file) | In the low-exposure population no difference by this gene was seen (Rocha et al., 2016). | 2–3 | Starting estimate. Fish supplies selenium, so varying it already covers that side; there is no need to take selenium because of your genotype. | Exploratory, not actionable |
| GPX1 rs1050450, C/T (Pro/Leu; G/A in the file) | In mothers in Hong Kong, carrying the minor allele was associated with less hair mercury (Chan et al., 2020: the minor allele is T, Leu, with a frequency of only 2.6% in that cohort, that is, very few carriers; the difference was significant in mothers who ate little fish and in the adjusted model). | 2–3 | Starting estimate. That clue is not a reason to stretch it. | Exploratory, not actionable |
| GPX1 rs1050450, T/T (Leu/Leu; A/A in the file) | This is the least common genotype (the file allele A is 22% in 1000 Genomes) and there are almost no data of its own. | 2–3 | Starting estimate and the same priority: varied fish, small and oily. | Exploratory, not actionable |
One more idea is a mechanistic hypothesis: mercury has a strong affinity for selenium, and some authors propose that the selenium-to-mercury ratio in fish modulates its toxicity (Ralston and Raymond, 2018). No validated protective threshold exists, and it is not a reason to ignore official warnings or to take selenium.
If you have a genetic file
If your file is from 23andMe or AncestryDNA, look for rs1695 (GSTP1) and rs1050450 (GPX1) (the steps are in the genetic file guide). GSTM1 and GSTT1 have no rsID because they are deletions: a standard chip does not read them, and "null" or "present" cannot be worked out from the file. The letters in the "file" column of the table below are those of the forward strand of the reference genome (the dbSNP one). For rs1695 they match the papers: A is isoleucine and G is valine. For rs1050450 they do not: the GPX1 genotypes in the table above are named on the gene's strand, with the letters of the papers (C and T, Pro and Leu), because GPX1 is read in the opposite direction; in the file you will see G and A. Check the header or documentation of your file for which strand it uses before applying the table.
| What you will see in your file | What this entry calls it |
|---|---|
| rs1695: AA, AG or GG | Ile/Ile, Ile/Val or Val/Val |
| rs1050450: GG | C/C (Pro/Pro) |
| rs1050450: GA or AG | C/T (Pro/Leu) |
| rs1050450: AA | T/T (Leu/Leu) |
| Any other combination (for example a C, a T, dashes or zeros) | Cannot be determined with this file |
Three more warnings. The chip may not include these variants. If they appear as dashes or zeros instead of letters, check how your file marks positions that were not read. And this table describes what has been observed in studies and does not replace an assessment by a health professional.
What to keep in mind when applying it
An estimate is not an official limit or a validated clinical study. EFSA sets the tolerable weekly intake by body weight, and AESAN gives recommendations by species and by population group; the number of cans is our own sum, with an assumed 55 g portion and an assumed content per can, and it is refined by your weight and by the drained weight of your can. You do not know the real mercury in each can, which is why the sum uses scenarios.
Tuna gives as well as takes. It is a source of high-quality protein, and AESAN points out that eating fish is safe and healthy and supplies iodine, selenium, calcium and vitamins A and D, as well as omega-3 (AESAN, 2019). That is why the proposal is to spread out the fish, not to remove it.
The genetic studies are of high exposure and of specific groups. The Amazonian cohorts ate far more fish than most readers, and one gave different results at low exposure (Rocha et al., 2016). Several studies are of children or of mothers in a single city, and the one in Jamaican children was about canned sardines and mackerel, not tuna. None tested changing fish intake according to genotype.
Conflict of interest. CESGEN offers nutrigenetic tests. This entry does not recommend taking one to decide how many cans to eat: the estimate comes from your weight and the assumed content of the can, and the genotype only fine-tunes it with an exploratory clue. The BLOOM and foodwatch report comes from non-governmental organisations that call for lowering the limit for tuna.
Sources
- Scientific Opinion on the risk for public health related to the presence of mercury and methylmercury in food, EFSA Panel on Contaminants in the Food Chain (CONTAM). EFSA Journal 10(12):2985, 2012
- Commission Regulation (EU) 2023/915 on maximum levels for certain contaminants in food, annex, section 3.3 (mercury), European Commission. Official Journal of the European Union, 2023
- Recommendations on fish consumption because of mercury (Recomendaciones de consumo de pescado por presencia de mercurio), Spanish Agency for Food Safety and Nutrition (AESAN), accessed 8 November 2026, 2019
- Effect of Gene-Mercury Interactions on Mercury Toxicokinetics and Neurotoxicity, Llop S, Ballester F, Broberg K. Current Environmental Health Reports 2:179-194 (PMID 26231367), 2015
- Evaluation of glutathione S-transferase GSTM1 and GSTT1 polymorphisms and methylmercury metabolism in an exposed Amazon population, Mazzaron Barcelos GR et al. Journal of Toxicology and Environmental Health A 75:960-970 (PMID 22852846), 2012
- Genetic polymorphisms in glutathione (GSH-) related genes affect the plasmatic Hg/whole blood Hg partitioning and the distribution between inorganic and methylmercury levels in plasma collected from a fish-eating population, de Oliveira AAS et al. BioMed Research International 2014:940952 (PMID 24696865), 2014
- GPX1 Pro198Leu polymorphism and GSTM1 deletion do not affect selenium and mercury status in mildly exposed Amazonian women in an urban population, Rocha AV et al. Science of the Total Environment 571:801-808 (PMID 27450956), 2016
- Genetic variation in glutathione-related genes and body burden of methylmercury, Schläwicke Engström K et al. Environmental Health Perspectives 116:734-739 (PMID 18560528), 2008
- Glutathione enzyme and selenoprotein polymorphisms associate with mercury biomarker levels in Michigan dental professionals, Goodrich JM et al. Toxicology and Applied Pharmacology 257:301-308 (PMID 21967774), 2011
- Association between genetic variations in GSH-related and MT genes and low-dose methylmercury exposure in children and women of childbearing age: a pilot study, Chan PHY et al. Environmental Research 187:109703 (PMID 32480025), 2020
- Factors associated with blood mercury concentrations and their interactions with three glutathione S-transferase genes (GSTT1, GSTM1, and GSTP1): an exposure assessment study of typically developing Jamaican children, Zaman SF et al. BMC Pediatrics 24:14 (PMID 38178055), 2024
- Associations of Metabolic Genes (GSTT1, GSTM1, GSTP1) and Blood Mercury Concentrations Differ in Jamaican Children with and without Autism Spectrum Disorder, Rahbar MH et al. International Journal of Environmental Research and Public Health 18:1377 (PMID 33546147), 2021
- Structure-activity relationships and thermal stability of human glutathione transferase P1-1 governed by the H-site residue 105, Johansson AS et al. Journal of Molecular Biology 278:687-698 (PMID 9600848), 1998
- Characterization of the glutathione S-transferase GSTT1 deletion: discrimination of all genotypes by polymerase chain reaction indicates a trimodular genotype-phenotype correlation, Sprenger R et al. Pharmacogenetics 10:557-565 (PMID 10975610), 2000
- Mercury's neurotoxicity is characterized by its disruption of selenium biochemistry, Ralston NVC, Raymond LJ. Biochimica et Biophysica Acta 1862:2405-2416 (PMID 29753115), 2018
- Toxic Tuna: chronicle of a health scandal (analysis of 148 cans of tuna from five countries), BLOOM and foodwatch (non-governmental organisations; a report, not a peer-reviewed paper), 2024
- dbSNP, rs1695 (GSTP1) and rs1050450 (GPX1): alleles, strand, protein consequence and 1000 Genomes frequencies (GRCh38), NCBI dbSNP, accessed 8 November 2026, 2026
Educational content from CESGEN, based on the evidence published up to the review date. It does not replace individual medical or dietary advice: to apply it to your own case, talk it through with your health professional. Nutrigenetics is an evolving field, and we review each piece when the evidence changes.