Are you carb-sensitive? What a DNA test measures (II)
A 79% in your genetic report is not a probability: what the weighted average of variants such as TCF7L2 and ACE means for populations and for you.
If your report says your carbohydrate sensitivity is 79%, what is that number telling you? It does not mean you have a 79% probability of anything. In the first part we saw how that percentage is calculated from six variants. Here we look at what it is mathematically, where it places you relative to a population, what it cannot say about you as an individual, and what you can try depending on the band you fall into.
What that percentage is
The score in the example is a weighted average. Each variant receives a value between 0 and 1 according to the number of risk copies you carry, and each has a weight: ACE 1.5, PPARG 3, TCF7L2 1.5, ADRB2 3, FABP2 2 and KCNJ11 3, adding up to 14. The score is the average of those values, with each variant counting in proportion to its weight. The 79% profile carried one risk copy in PPARG, ADRB2, FABP2 and KCNJ11, which add up to 3 + 3 + 2 + 3 = 11 of the 14 weight points, and 11 ÷ 14 is 0.79.
That makes it an index: it measures what share of the panel's maximum load you accumulate, with each variant weighing according to the strength of its evidence. It is not a probability, because the formula includes no disease frequency and no absolute risk. The 79% and the 5% of the example profiles are not a 79% and a 5% of anything measurable: they say that the third profile accumulates far more weighted load than the second.
The polygenic score used in research is also a weighted sum of risk alleles, but with a different choice of weights: the effect size of each variant in genome-wide association studies (Janssens, 2019). With the weights as logarithms of odds ratios, adding is the same as multiplying relative risks. For TCF7L2, the relative risk of 1.45 with one copy and 2.41 with two (Grant, 2006) is 0.37 and 0.88 in logarithms: one copy contributes 42% of what two contribute. The example algorithm gave it 50%, a reasonable approximation that could be refined.
What is assumed when adding up
Adding variants is convenient and rests on five assumptions. Each one turns into a question you can put to whoever hands you a report.
| Assumption | What it means | What you can ask |
|---|---|---|
| Variants contribute independently | Adding assumes they do not influence one another. Those close together on a chromosome tend to be inherited together and may count the same signal twice. | Whether the report includes variants close to each other. |
| The scale of the sum is appropriate | With log odds ratios, the sum multiplies risks; with other values, the relationship between copies and risk is different. | How much one copy counts compared with two. |
| The weight reflects the effect | In a polygenic score, the weight is the effect size. In the example, it ranks by strength of evidence, not by magnitude. | Where the weights come from. |
| Your population resembles the study's | The scores available today are several times more accurate in people of European ancestry than in others (Martin, 2019). | Which population it was calibrated in. |
| Percentages are comparable | The result is divided by the sum of the panel's weights: with another panel, the same genotype gives a different percentage. | Which variants and weights it uses; do not compare percentages from different reports. |
In a population: a place in a distribution
To see what that sum does in a population, I simulated an example one with the same six variants, the risk allele at 30% in all of them (a teaching frequency, not a measured one) and the variants independent of one another (figure 2).
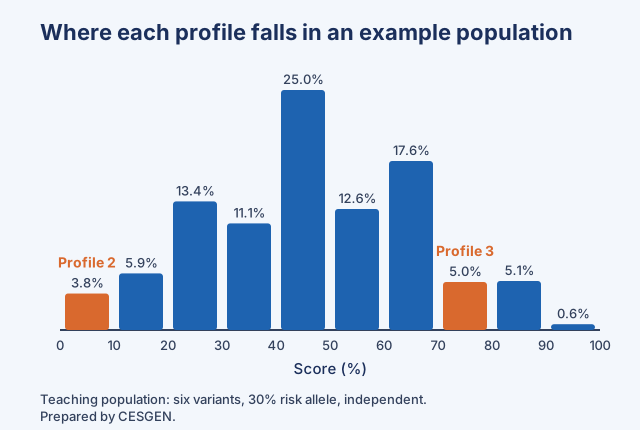
The mean of that population is 47%. The extremes are rare: 3.8% score 5% or less, and reaching 100% happens to fewer than one person in a thousand. And 7.5% score 79% or more, so that 79% places you in the upper tail of the distribution. That place, the percentile, is what the score describes well, and always relative to a reference population. If the reference changes, the same 79% lands somewhere else: with the risk allele at 20%, 2% of the population reaches it, and with 40%, 19% does.
Going from a place in the distribution to an absolute risk requires one more piece of data, the frequency of the disease in that population, and translating a percentile into lifetime risk remains one of the challenges of these scores (Lewis and Vassos, 2020). With invented figures to illustrate: if the average risk of a disease were 10% and people in your band had it multiplied by 1.5, the estimate for that group would be 15%.
With variants from across the whole genome, a score for type 2 diabetes identified 3.5% of the population as having more than three times the average risk (Khera, 2018). That is the kind of result that justifies continuing to study these scores, and it does not carry over unchanged to a six-variant panel or to the response to diet.
In an individual: group averages
The weights and the risks come from comparing groups, so the score describes groups of people with similar profiles more than any one person. That an association is strong enough to explain why a group falls ill does not mean it can predict who will fall ill (Wald and Old, 2019), and the current ability of these scores to discriminate in the general population is low (Lewis and Vassos, 2020). Nor are they equally accurate across ancestries (Martin, 2019). What your score does allow is to rank priorities and decide what to try for a few weeks, with your waist, your energy and your blood tests as the check.
What you can try depending on your band
The table uses bands in your reference population. The right-hand column is a CESGEN proposal to try and observe, not the result of an intervention study, and the cut-offs at quartiles are a teaching convention.
| Band in your reference population | What you can try |
|---|---|
| Lowest quarter | Your profile accumulates little load. The general guideline is your starting point: quality carbohydrates, fibre and free sugars below 10% of energy. There is no genetic reason to measure starch portions beyond that; keep up your regular blood tests and your movement habits. |
| Middle half | This is where most people fall, and the score barely distinguishes you from others. Look at which specific variants weigh in your report and choose the matching lever (table in the first part): protein and fibre with starch, a walk after eating or strength work two or three times a week. Try one for a few weeks. |
| Highest quarter | Try all three levers at once for a few weeks: a measured portion of starch, protein at every meal and strength work two or three times a week. Compare your waist and fasting glucose, and discuss what you observe with your health professional. |
What to bear in mind
A weighted average of alleles is a simple model of something complex, and it is worth asking, as Janssens (2019) puts it, whether the sum measures what we think it measures. The least tested part is the response to diet: in the DIETFITS trial, covered in the first part, a three-gene pattern showed no interaction between genotype and diet.
CESGEN teaches nutrigenomics courses, where normalisation and calibration are explained with worked examples. The table describes what has been observed in studies and does not replace a professional's assessment.
What you can do
When you receive a report with a score, ask five things: which variants it includes, how much each one weighs and where those weights come from, how much one copy counts compared with two, which population the percentage was calibrated in, and whether it gives an absolute risk or only an index. With those answers you will know what the number measures and what concrete decision you can make with it. In the coming posts we will look in more detail at TCF7L2, AMY1 and the evening meal with MTNR1B.
Sources
- Variant of transcription factor 7-like 2 (TCF7L2) gene confers risk of type 2 diabetes, Grant SFA et al. Nature Genetics 38:320-323 (PMID 16415884), 2006
- Validity of polygenic risk scores: are we measuring what we think we are?, Janssens ACJW. Human Molecular Genetics 28:R143-R150 (PMID 31504522), 2019
- Genome-wide polygenic scores for common diseases identify individuals with risk equivalent to monogenic mutations, Khera AV et al. Nature Genetics 50:1219-1224 (PMID 30104762), 2018
- Polygenic risk scores: from research tools to clinical instruments, Lewis CM, Vassos E. Genome Medicine 12:44 (PMID 32423490), 2020
- The illusion of polygenic disease risk prediction, Wald NJ, Old R. Genetics in Medicine 21:1705-1707 (PMID 30635622), 2019
- Clinical use of current polygenic risk scores may exacerbate health disparities, Martin AR et al. Nature Genetics 51:584-591 (PMID 30926966), 2019
Educational content from CESGEN, based on the evidence published up to the review date. It does not replace individual medical or dietary advice: to apply it to your own case, talk it through with your health professional. Nutrigenetics is an evolving field, and we review each piece when the evidence changes.