Are you carb-sensitive? What a DNA test measures (I)
Same plate of rice, different blood sugar: how a nutrigenomics test adds up variants in AMY1, SLC2A2, TCF7L2 and IRS1 into a carbohydrate score.
Two people eat the same plate of rice and their blood sugar rises differently. A study that tracked the glucose of 800 people for a week, across 46,898 meals, found wide variation in the response to identical meals (Zeevi et al., 2015). Genes are one of the pieces that have been studied, which is why nutrigenomics tests offer a "carbohydrate sensitivity" result. There is no single gene that measures it: the result adds up variants in genes such as AMY1, SLC2A2, TCF7L2 and IRS1, each at a different step on the path starch follows through the body. Here you can see what each step measures, what you can try depending on what your report flags, and how it all becomes a percentage.
Four steps in the body, four example genes
The third column is a CESGEN proposal to try and observe for a few weeks (waist, energy and, if you have blood tests, fasting glucose). It is not the result of an intervention study.
| Step and gene | What has been observed | What you can try |
|---|---|---|
| Starch digestion: AMY1, the copy number of the salivary amylase gene | More copies mean more amylase in saliva and in the blood. Each copy fewer was linked to a higher BMI and to an odds ratio for obesity of 1.19; between the 10% with the most copies (more than 9) and the 10% with the fewest (fewer than 4), the risk differs about eightfold, and the finding was replicated in 6,200 people (Falchi, 2014). Populations with starch-rich diets have more copies on average (Perry, 2007). | With few copies: prioritise quality starches (pulses, intact wholegrains, potato and rice cooked and cooled) and measure the portion. With average or many copies: no added limit; keep fibre as the usual companion to starch. |
| Sugar sensing: SLC2A2, the Thr110Ile variant of the GLUT2 transporter | Ile carriers ate more sugars: 112 versus 86 g a day in one population (111 versus 82 at a second visit) and 131 versus 115 g a day in another. Fat, protein and alcohol intake did not change (Eny, 2008). | If you are a carrier: a breakfast with protein and fibre, fruit as the default sweet and sweet foods out of sight. If you are not, your cravings have no genetic basis here, and your reference is the general guideline: free sugars below 10% of energy (WHO, 2015). |
| Insulin secretion: TCF7L2 (and MTNR1B) | With one copy of the TCF7L2 risk allele, the relative risk of type 2 diabetes was 1.45, and with two copies, 2.41, in cohorts from Iceland, Denmark and the USA (Grant, 2006). The MTNR1B risk genotype was linked to a lower early insulin response to glucose (Lyssenko, 2009). | With the variant: low-glycaemic-index carbohydrates with fibre, accompanied by protein, and a walk after eating; with MTNR1B, keep the bulkiest carbohydrates for lunchtime. Without the variant: the general guideline of quality carbohydrates is your starting point, and your regular check-up remains your reference. |
| Insulin action: IRS1 | A variant near IRS1 (rs2943641) was linked to insulin resistance and hyperinsulinaemia in 14,358 people from France, Denmark and Finland (Rung, 2009). | With the variant: strength training two or three times a week and your waist as a gauge. Without it: keep the same regular habit of strength work and walking, which is the foundation of any profile. |
The link between TCF7L2 and the risk of type 2 diabetes is among the best replicated in the genetics of that disease, and the link between AMY1 and weight was replicated in 6,200 people. What to do with them at the table is the least tested part: it is framed as something to try and observe (exploratory), not as a proven rule.
How it is calculated: from variants to a percentage
A scoring algorithm turns those variants into a single number. The one I designed years ago for a nutrigenetics test used six variants (in ACE, PPARG, TCF7L2, ADRB2, FABP2 and KCNJ11) and four steps (figure 1).
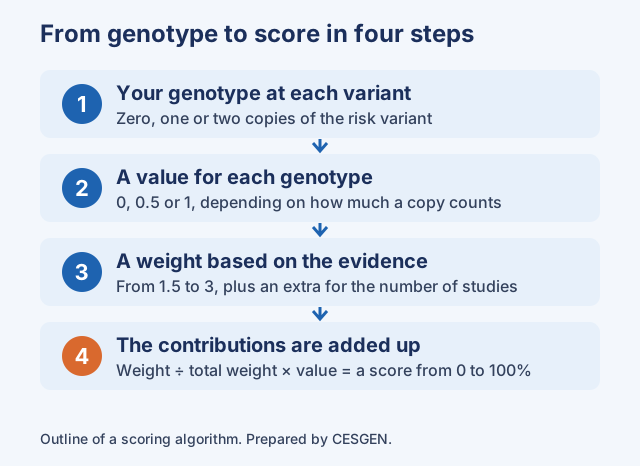
1. The genotype. The algorithm records how many copies of the risk variant you carry: none, one or two.
2. A value for each genotype. It runs from 0 to 1. In TCF7L2 and ACE, one risk copy counted half and two copies counted in full (in TCF7L2, in line with the 1.4 and 2 figures in use at the time). In the other four variants, a single copy already counted in full.
3. A weight based on the evidence. From 1.5 to 3 points depending on the type of evidence: an amino-acid change weighs more than an association found in studies with no known mechanism. An extra of up to 1 point is added when there are more than ten studies.
4. The sum. Each variant's contribution is its weight divided by the total of all the weights, multiplied by its value. The sum of the contributions is the score, from 0 to 100%. With weights of 1.5, 3, 1.5, 3, 2 and 3 (total 14), these are three example profiles:
| Example profile | Calculation | Score | What you can try |
|---|---|---|---|
| No risk variants in the six | 0 | 0% | The general guideline as a base: quality carbohydrates, fibre and free sugars below 10% of energy. Repeat your blood tests at the usual interval. |
| One risk copy of TCF7L2 and none of the others | 0.5 × 1.5 ÷ 14 | 5% | Low-glycaemic-index carbohydrates with fibre and protein, and a walk after eating. |
| One risk copy in PPARG, ADRB2, FABP2 and KCNJ11 | (3 + 3 + 2 + 3) ÷ 14 | 79% | Try three levers at once for a few weeks: a measured portion of starch, protein at every meal and strength work two or three times a week. Compare your waist and fasting glucose. |
The profiles, the calculations and the proposals in the last column are a teaching example by CESGEN using that algorithm, not the result of a study.
Look at what the example shows: the second profile, with one of the best-studied variants, scores 5%, and the third scores 79%, because the result depends on the weights and on how much a copy counts, decisions made by whoever designs the algorithm. Two algorithms with the same genes can give different scores, which is why it pays to ask how any report was calculated. Today I would review each of those six variants against the recent literature before using it.
What to bear in mind
A score helps you order priorities and decide what to try; it does not assign a low-carbohydrate or a low-fat diet. In the DIETFITS trial, with 609 adults, a three-gene pattern chosen with similar criteria showed no interaction between genotype and diet (P = 0.20). Your glucose response also depends on your gut microbiota, sleep and activity, and the algorithm that combined those data with blood tests and body measurements accurately predicted the response to each meal (Zeevi, 2015). AMY1 is not a letter of DNA but a copy number, and it is measured with specific techniques that differ from those behind a consumer genetic file.
CESGEN teaches nutrigenomics courses, where this calculation is explained step by step. The table describes what has been observed in studies and does not replace a professional's assessment.
What you can do
Ask whoever gives you a carbohydrate report which variants it uses, how much each one weighs and how the result is added up. Try the proposal that matches your profile for a few weeks, using your waist and energy as a guide, and check with your blood tests whether it works for you. In the second part we look at what that percentage means, in a population and for one person. After that we will go into more detail on TCF7L2, AMY1 and the evening meal with MTNR1B.
Sources
- Personalized Nutrition by Prediction of Glycemic Responses, Zeevi D et al. Cell 163:1079-1094 (PMID 26590418), 2015
- Low copy number of the salivary amylase gene predisposes to obesity, Falchi M et al. Nature Genetics 46:492-497 (PMID 24686848), 2014
- Diet and the evolution of human amylase gene copy number variation, Perry GH et al. Nature Genetics 39:1256-1260 (PMID 17828263), 2007
- Genetic variant in the glucose transporter type 2 is associated with higher intakes of sugars in two distinct populations, Eny KM et al. Physiological Genomics 33:355-360 (PMID 18349384), 2008
- Variant of transcription factor 7-like 2 (TCF7L2) gene confers risk of type 2 diabetes, Grant SFA et al. Nature Genetics 38:320-323 (PMID 16415884), 2006
- Common variant in MTNR1B associated with increased risk of type 2 diabetes and impaired early insulin secretion, Lyssenko V et al. Nature Genetics 41:82-88 (PMID 19060908), 2009
- Genetic variant near IRS1 is associated with type 2 diabetes, insulin resistance and hyperinsulinemia, Rung J et al. Nature Genetics 41:1110-1115 (PMID 19734900), 2009
- Effect of Low-Fat vs Low-Carbohydrate Diet on 12-Month Weight Loss in Overweight Adults and the Association With Genotype Pattern or Insulin Secretion: The DIETFITS Randomized Clinical Trial, Gardner CD et al. JAMA 319:667-679 (PMID 29466592), 2018
- Guideline: Sugars intake for adults and children, World Health Organization (WHO), 2015
Educational content from CESGEN, based on the evidence published up to the review date. It does not replace individual medical or dietary advice: to apply it to your own case, talk it through with your health professional. Nutrigenetics is an evolving field, and we review each piece when the evidence changes.