Does your vitamin D test tell the whole story?
The GC gene makes the carrier protein for vitamin D, and its variants change what your test shows. What the evidence says and what to do with food and sunshine.
Plenty of people know their vitamin D number, the 25(OH)D on a blood test, and many decisions are made from it. What is often overlooked is that part of that number depends on your genotype: the GC gene makes the protein that carries vitamin D through the blood, and its variants are associated with what the test shows. That turns into specific recommendations for each genotype: with some, the value tends to come out lower, and it is worth including sources of vitamin D throughout the year and asking for the result to be read with that information; with others, it tends to come out higher, although a low result still calls for looking at the whole context (sunshine, diet, weight). And the usual base stays yours: oily fish, eggs, fortified dairy and the sunshine of the season.
One letter, one change
The GC gene, on chromosome 4, makes the carrier protein for vitamin D (DBP, for vitamin D-binding protein). Its two best-studied variants are rs7041 (Asp432Glu: an aspartic acid becomes glutamic acid) and rs4588 (Thr436Lys: a threonine becomes lysine). Combined, they give three common forms of the protein, which the literature calls Gc1F, Gc1S and Gc2. These are common variants and they differ between populations: the Glu allele of rs7041 appears in 58% of European chromosomes, 30% of East Asian ones and 9% of African ones; the Lys allele of rs4588, in 25%, 26% and 7% (1000 Genomes Project). In the cohort of Powe and colleagues (2013), the Gc1F form was the most common among Black participants and Gc1S among white participants.
One quirk to know when reading your file: GC is read in the opposite direction to the forward strand of the reference genome, so in dbSNP and in forward-strand files rs7041 appears as A/C and rs4588 as G/T, whereas the papers use the letters of the gene: T/G at rs7041 and C/A at rs4588. This entry always gives both forms. A third variant, rs2282679, was the strongest signal in genome-wide studies in this region; it lies in an intron of the gene and almost always travels with rs4588 (r² > 0.99 in two cohorts; Wang and colleagues, 2010), so it carries the same information.
The mechanism, step by step
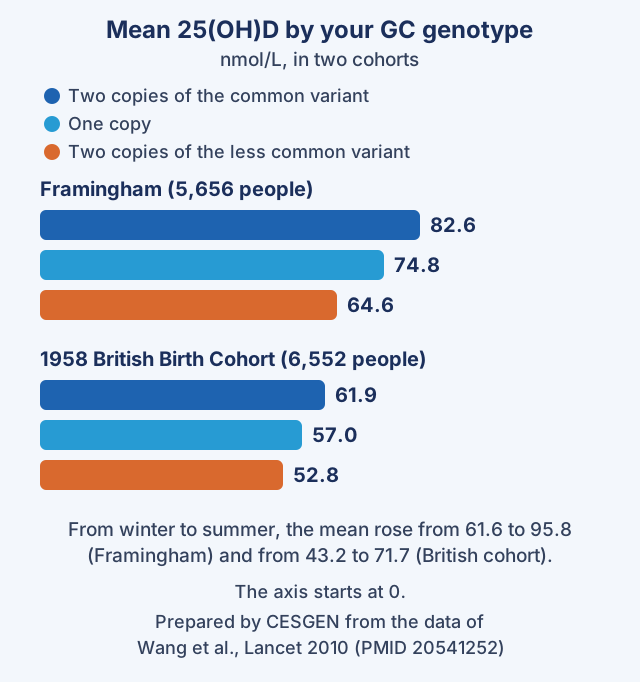
1. Your test measures total 25(OH)D. The blood concentration of 25-hydroxyvitamin D depends on sun exposure and diet (Wang and colleagues, 2010), and the season changes it a great deal: from winter to summer, the mean rose from 61.6 to 95.8 nmol/L in Framingham and from 43.2 to 71.7 nmol/L in a British cohort.
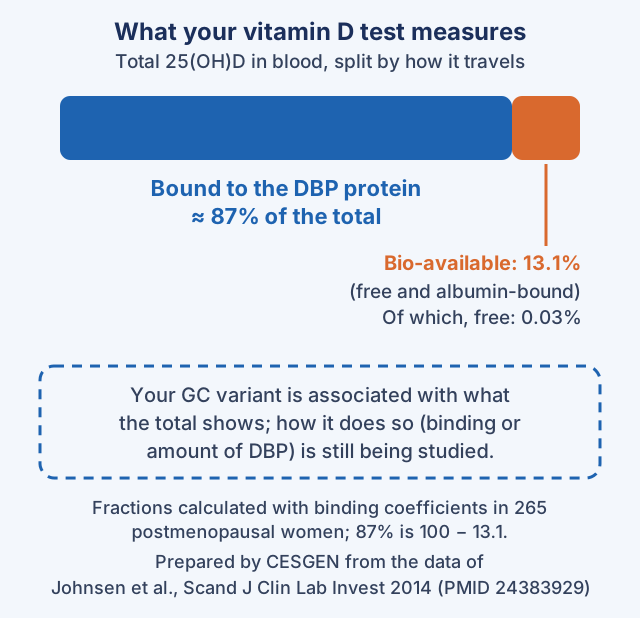
2. In the blood, almost all of it travels bound to DBP. 25(OH)D circulates bound to DBP (85-90%) and to albumin (10-15%), and only a small fraction is free (Denburg and colleagues, 2016). According to the free hormone hypothesis, only the free form is biologically active (Johnsen and colleagues, 2014). With binding coefficients, in 265 postmenopausal women the calculated free fraction was 0.03% of the total and the bio-available one (free plus albumin-bound), 13.1%.
3. GC variants are associated with total 25(OH)D. In 33,996 people of European ancestry, the strongest signal for 25(OH)D was in GC (rs2282679; Wang and colleagues, 2010), and a later study of 79,366 people confirmed it (Jiang and colleagues, 2018). In the Powe cohort (2013), each copy of the T allele of rs7041 (gene letters) was associated with 2.0 ng/ml less total 25(OH)D in Black participants (no clear effect in white participants), and each copy of the A allele of rs4588 with 2.5 ng/ml less in white participants (no clear effect in Black participants). How they do it, whether by changing how vitamin D binds to the protein or how much protein there is, has not been settled.
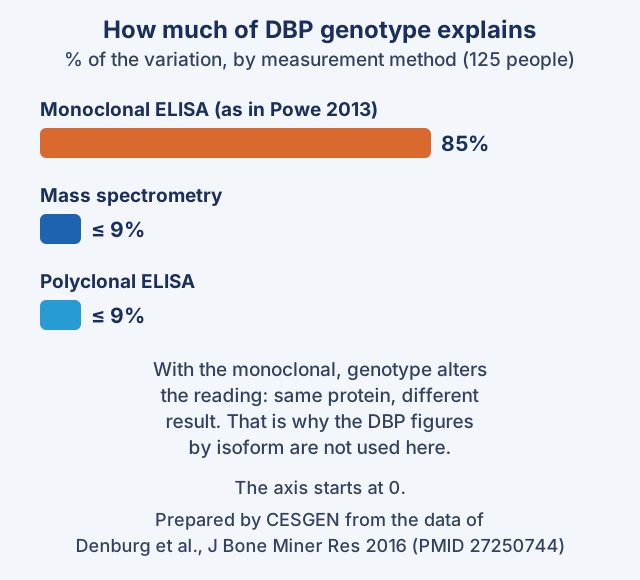
4. Measuring DBP is not trivial. Powe and colleagues (2013) measured DBP with a monoclonal ELISA, and the DBP figures by isoform that they obtained depend on that method. A later study of 125 people from a chronic kidney disease cohort compared three methods: the monoclonal ELISA reads DBP differently depending on the isoform (genotype explained 85% of the variation), but with mass spectrometry or a polyclonal ELISA it explained at most 9%; with those two methods, in that cohort, the calculated free and bio-available 25(OH)D were lower in Black than in white participants, just like the total (Denburg and colleagues, 2016). That is why this entry uses neither the DBP figures by isoform nor Powe's calculation of bio-available 25(OH)D, and why calculated free 25(OH)D remains a hypothesis under study.
How sure are we? That GC variants are associated with total 25(OH)D is very well established: studies of tens of thousands of people have seen it. How they do it, and whether calculated free 25(OH)D reflects your vitamin D status better than the total, are open questions; what the usual test measures is the total.
Genotype and diet: what the evidence says
The practical question is what is worth doing according to your genotype. What has been published lets us answer on three fronts: how to read your test, what to do with your plate and the sun, and what to expect if your health professional suggests a supplement. The tables describe what was observed in studies, in groups of people, and not anyone's individual case; the letters are those of the forward strand of the reference genome.
Your total test: rs4588 (or rs2282679)
In two cohorts of Europeans, the mean level of 25(OH)D changed with the GC genotype (rs2282679 in Framingham and rs4588 in the 1958 British cohort; Wang and colleagues, 2010).
| Your genotype | What has been observed | What you can do | Evidence |
|---|---|---|---|
| GG at rs4588 (TT at rs2282679): two copies of the common variant | The highest means: 82.6 nmol/L in Framingham and 61.9 in the British cohort (Wang and colleagues, 2010). | Your genotype does not carry the lower mean seen in TT: review your sources and discuss a low result with your health professional as a whole (sunshine, diet, weight and other genes). | Replicated association, uncertain clinical utility |
| GT (TG at rs2282679): one copy of the less common variant | Intermediate values: 74.8 and 57.0 nmol/L (Wang and colleagues, 2010). | Include sources of vitamin D throughout the year and pay attention to the season in which you have the test: the move from winter to summer changed the mean more than genotype did. | Replicated association, uncertain clinical utility |
| TT (GG at rs2282679): two copies of the less common variant | The lowest means: 64.6 and 52.8 nmol/L (Wang and colleagues, 2010). | Your genotype is associated with the lowest values: include sources of vitamin D throughout the year, especially in winter, and ask your health professional to read your test with that in mind; if a supplement is suggested, discuss whether to repeat the test to see how you respond (exploratory adjustment). | Replicated association, uncertain clinical utility (repeating the test after a supplement is exploratory) |
It helps to put the figures in perspective. The three confirmed loci explained up to 1-4% of the variation in 25(OH)D, and in both cohorts the difference between the extreme genotypes (18.0 and 9.1 nmol/L) was smaller than between winter and summer (34.2 and 28.5 nmol/L). Genotype guides; the season and your sources weigh more in the result on the day.
Other genes count too. The same studies found variants near DHCR7 and CYP2R1, and a score combining the three signals (GC, DHCR7 and CYP2R1) separated people: the quarter with the highest score had 2.47 times the odds of 25(OH)D below 75 nmol/L (95% CI, 2.20 to 2.78) and 1.92 times those of below 50 nmol/L (1.70 to 2.16), against the lowest quarter (Wang and colleagues, 2010). A later study of 79,366 people of European ancestry found two more signals (SEC23A and AMDHD1) and estimated that common variants explain 7.5% of the heritability of 25(OH)D (Jiang and colleagues, 2018).
rs7041, the other variant of the protein
rs7041 was also associated with total 25(OH)D in the genome-wide studies (p = 6.3×10⁻⁵⁹; Wang and colleagues, 2010), but the effect per copy is only given by group in the Powe cohort (2013), and it differs between Black (1,126) and white (855) participants. The letters in your file (A and C) are the complements of those in the paper (T and G).
| Your genotype | What has been observed | What you can do | Evidence |
|---|---|---|---|
| CC at rs7041: no copy of the A allele in the file (T in the gene) | This is the reference in the Powe study (2013). | rs7041 calls for no adjustment of its own: read your test alongside the season, your weight and your sources. | Replicated association, uncertain clinical utility |
| AC: one copy | Per copy, 2.0 ng/ml less total 25(OH)D in Black participants (95% CI, −2.9 to −1.1); no clear effect in white participants (0.2; −1.3 to 1.7) (Powe and colleagues, 2013). | If your ancestry is African, your total test may come out somewhat lower: include sources of vitamin D throughout the year and discuss the result in context with your health professional. | Replicated association, uncertain clinical utility (the per-copy effect was seen in Black but not white participants) |
| AA: two copies | The same effect per copy; with two copies, about 4.0 ng/ml less if the effect adds up, an extrapolation of the figure in Black participants that the study did not test. | With two copies and African ancestry, this is the genotype with the most room for your total test to come out low: include sources of vitamin D throughout the year, especially in winter, and ask for it to be read with that in mind; otherwise, rs7041 calls for no adjustment of its own. | Replicated association, uncertain clinical utility (the per-copy effect was seen in Black but not white participants) |
If your health professional suggests a supplement
Three studies looked at whether genotype changes how much 25(OH)D rises with a supplement. Didriksen and colleagues (2013) pooled three randomised trials giving 40,000 IU of vitamin D a week for 6 months: people with the variants (in DBP and CYP2R1) associated with less baseline 25(OH)D rose less, and so did those with a high BMI. In a trial of 39 Thai volunteers given 400 IU of vitamin D3 or D2, plus a calcium supplement, a day for 3 months, people with CA or AA at rs4588 (gene letters) rose less than CC with vitamin D3, and with D2 there was no difference (Nimitphong and colleagues, 2013). In a trial of 619 Iranian girls given 50,000 IU a week for 9 weeks, rs4588 modified the response (Mehramiz and colleagues, 2019). The recommendation that follows is practical: if your health professional decides to supplement, discuss whether to repeat the test to see how you respond, because the rise varies with genotype, weight and starting level; this genotype-based adjustment is exploratory.
On the levels of evidence: that GC variants are associated with total 25(OH)D has been replicated in cohorts of thousands of people (‘Replicated association, uncertain clinical utility’); whether calculated free or bio-available 25(OH)D is a better measure is unresolved, and that genotype changes the rise with a supplement rests on studies of different sizes and with different allele letters (‘Exploratory, not actionable’). This entry does not recommend any supplement or dose according to your variant: the doses that appear are those of the trials.
Where is vitamin D?
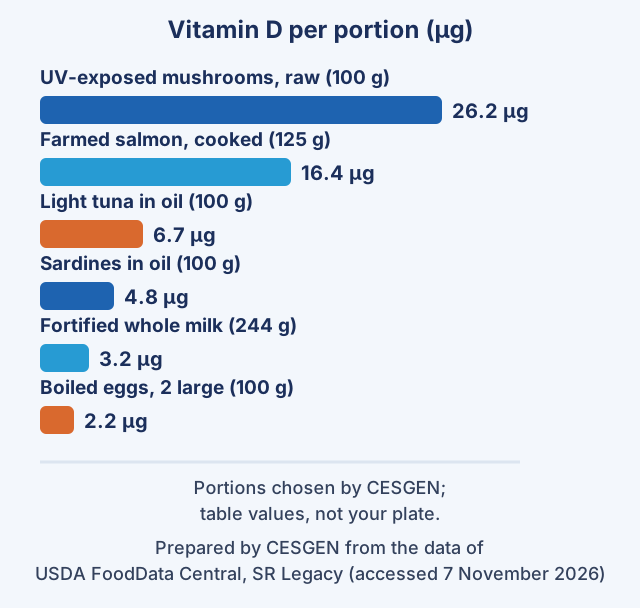
Sunlight on the skin and diet are the two main determinants (Wang and colleagues, 2010), and the season matters: in both cohorts, the mean level rose from winter to summer by 34.2 and 28.5 nmol/L. At the table, according to the USDA tables, oily fish and mushrooms exposed to ultraviolet light provide far more per portion than egg or fortified milk; the same whole milk without fortification provides 0.1 µg per 100 g, against 1.3 µg when fortified.
If you have a genetic file
If your file is from 23andMe or AncestryDNA, look for rs4588, rs7041 and, if you wish, rs2282679 (the steps are in the genetic file guide). This entry uses the letters of the forward strand of the reference genome (the dbSNP one); check the header or the documentation of your file to see which strand it uses before applying the table. None of the three variants has as its usual alleles two letters that are complementary to each other: if your file were on the other strand you would see C and A at rs4588 instead of G and T, T and G at rs7041 instead of A and C, and A and C at rs2282679 instead of T and G. These examples hold for the usual alleles; if you see a different letter or an ambiguous combination, confirm the strand in your file's documentation before translating the letters. If your file is on the other strand, replace each letter with its complement.
| What you will see in your file | What this entry calls it | What has been observed |
|---|---|---|
| rs4588: GG (rs2282679: TT) | Two copies of the common variant | The highest mean 25(OH)D of the cohorts |
| rs4588: GT or TG (rs2282679: TG or GT) | One copy of the less common variant | Intermediate means |
| rs4588: TT (rs2282679: GG) | Two copies of the less common variant | The lowest means |
| rs7041: CC | No copy of the allele associated with less total 25(OH)D in Black participants | The reference in the Powe study |
| rs7041: AC or CA | One copy | 2.0 ng/ml less per copy in Black participants; no clear effect in white participants |
| rs7041: AA | Two copies | The same effect per copy, with two copies |
| Any other combination (for example a different letter, or dashes or zeros) | Cannot be determined with this file | Check the strand and format of your file before interpreting |
Three more warnings. The chip behind your file may not include one of these variants; if you cannot find it, check whether your chip and file format include it. If it appears with dashes or zeros instead of letters, check how your file marks positions that were not read. And no variant tells you how much vitamin D you have or how much you need. This table describes what has been observed in studies and does not replace the assessment of a health professional.
What to bear in mind when applying it
What the usual test measures is the total. Free and bio-available 25(OH)D are calculations that depend on how DBP is measured: with methods not biased by genotype, in a chronic kidney disease cohort they were lower in Black than in white participants, just like the total (Denburg and colleagues, 2016), and they are still being investigated. Johnsen and colleagues (2014) calculated their fractions from DBP measured with a method that their abstract does not identify.
Bones and parathyroid hormone. In the Powe cohort, parathyroid hormone levels rose as total or calculated 25(OH)D fell, in both groups; bone density was higher in Black than in white participants (1.05 against 0.94 g/cm²) and, among homozygous participants, it generally rose with 25(OH)D only in white participants. In the 265 postmenopausal women with low bone density in Johnsen's study, only calculated free and bio-available 25(OH)D related to bone density, mostly in those not taking supplements. These are observed associations, not proof of cause, and free and bio-available measures depend on the method used to measure DBP, so they are best read with caution.
Measurement methods differ between studies. Wang and colleagues measured 25(OH)D with different methods depending on the cohort (radioimmunoassay, chemiluminescent assay, ELISA or mass spectrometry), so the comparisons in this entry are within each cohort and not between them.
The studies come from specific populations. The GWAS are of people of European ancestry, Powe's is of Black and white Americans, and the supplementation trials are of Norwegians, Thais and Iranians, some of them small; the frequencies of the variants differ a great deal between populations.
Genotype adds to weight, season and sources. A high BMI was associated with lower baseline 25(OH)D and a smaller rise after supplementing (Didriksen and colleagues, 2013), and the season changed the mean more than any genotype did.
This entry does not diagnose or recommend supplements because of a variant. It does not say whether you are deficient or how much vitamin D you need: your health professional decides that from your test, your situation and your sources. The doses that appear are those of the trials.
What you can do with this information
Include sources of vitamin D throughout the year. Oily fish regularly, eggs, fortified dairy and, if you can find them, mushrooms exposed to ultraviolet light; per portion, oily fish and those mushrooms provide the most, according to the USDA.
Look at when you have the test. In both cohorts, the mean was higher in summer than in winter: it rose by 34.2 and 28.5 nmol/L, more than the difference between the extreme genotypes.
Read your test with your genotype. If you are GG at rs4588, your genotype does not carry the lower mean: review your sources and discuss a low result with your health professional as a whole. If you are GT, pay attention to the season and your sources. If you are TT, your total test tends to come out lower: include sources of vitamin D, especially in winter, and ask for it to be interpreted with your genotype before deciding on the figure alone. With rs7041, the per-copy effect that was seen was in the Black American participants of the Powe cohort.
If a supplement is suggested, discuss whether to repeat the test. The rise varies with genotype, weight and starting level; a second test shows how you respond. It is an exploratory adjustment.
Ask for interpretation with context. If you have your genotype, read it alongside your test, the season, your weight and your diet, with your health professional: that way it becomes a useful clue and not a label.
This is how genetic information improves eating: it does not decide for you, but it helps you read your test and know where to put the emphasis.
Sources
- Vitamin D-binding protein and vitamin D status of black Americans and white Americans, Powe CE et al. New England Journal of Medicine 369:1991-2000 (PMID 24256378), 2013
- Common genetic determinants of vitamin D insufficiency: a genome-wide association study, Wang TJ et al. The Lancet 376:180-188 (PMID 20541252), 2010
- Genome-wide association study in 79,366 European-ancestry individuals informs the genetic architecture of 25-hydroxyvitamin D levels, Jiang X et al. Nature Communications 9:260 (PMID 29343764), 2018
- Serum free and bio-available 25-hydroxyvitamin D correlate better with bone density than serum total 25-hydroxyvitamin D, Johnsen MS et al. Scandinavian Journal of Clinical and Laboratory Investigation 74:177-183 (PMID 24383929), 2014
- The serum 25-hydroxyvitamin D response to vitamin D supplementation is related to genetic factors, BMI, and baseline levels, Didriksen A et al. European Journal of Endocrinology 169:559-567 (PMID 23935129), 2013
- Changes in circulating 25-hydroxyvitamin D according to vitamin D binding protein genotypes after vitamin D3 or D2 supplementation, Nimitphong H et al. Nutrition Journal 12:39 (PMID 23556437), 2013
- Associations of vitamin D binding protein variants with the vitamin D-induced increase in serum 25-hydroxyvitamin D, Mehramiz M et al. Clinical Nutrition ESPEN 29:59-64 (PMID 30661702), 2019
- Comparison of Two ELISA Methods and Mass Spectrometry for Measurement of Vitamin D-Binding Protein: Implications for the Assessment of Bioavailable Vitamin D Concentrations across Genotypes, Denburg MR et al. Journal of Bone and Mineral Research 31:1128-1136 (PMID 27250744), 2016
- USDA FoodData Central, SR Legacy: vitamin D in farmed salmon, light tuna in oil, sardines in oil, whole milk with vitamin D, boiled egg and UV-exposed mushrooms, US Department of Agriculture, accessed 7 November 2026, 2019
- Ensembl and dbSNP, rs7041, rs4588 and rs2282679: alleles, forward strand, consequence in the canonical transcript and 1000 Genomes frequencies (GRCh38), NCBI dbSNP and Ensembl, accessed 7 November 2026, 2026
Educational content from CESGEN, based on the evidence published up to the review date. It does not replace individual medical or dietary advice: to apply it to your own case, talk it through with your health professional. Nutrigenetics is an evolving field, and we review each piece when the evidence changes.