How a gene test decides which diet suits you
How a nutrigenomics test turns the FABP2, PPARG, ADRB2 and ADRB3 genes into a diet, what a large trial found, and what AI and polygenic scores add today.
A nutrigenomics test tells you "your diet is low-fat" or "low-carbohydrate", and behind that sits an algorithm. Understanding how it works helps you read any genetic report with a critical eye. A US patent application published in 2010 (US 2010/0136561 A1) describes one in full detail: five variants in four genes (FABP2, PPARG, ADRB2 and ADRB3) that end in one of six diet and exercise categories. It is a good example of how a genetic algorithm is built, what happened when it was tested in a large trial, and how it compares with what artificial intelligence does today. Let's take it step by step.
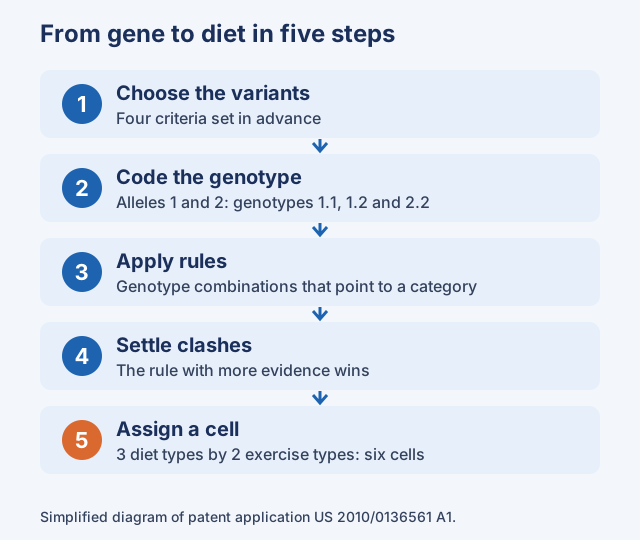
Five steps, from gene to diet
The application does not invent new genetics: it organises what was already known, and that organisation is the algorithm.
1. Choose the variants with criteria set in advance. To enter the panel, a variant had to meet four conditions: an association with weight, body fat or BMI in three or more independent studies pointing the same way; a plausible biological role for the gene; a demonstrated functional effect, in the DNA or in biomarkers; and a response to diet or exercise that differed by genotype in at least two independent studies. The application applied those criteria to the literature published up to April 2007, and four genes passed.
2. Code each genotype. Each variant has two alleles, 1 and 2, and your genotype is 1.1, 1.2 or 2.2. Turning letters into codes lets the rules be written compactly. In PPARG (rs1801282), for example, allele 1 is C (proline) and allele 2 is G (alanine).
3. Apply rules. A rule links a genotype, or a combination, to a category, and each carries a biological reason. Someone with the Thr54 variant of FABP2, which according to the application increases fat absorption in the gut, and who is Pro/Pro in PPARG, which is more sensitive to the amount of fat in the diet, falls into "responds to cutting fat". Someone with the Ala variant of PPARG or the Glu27 variant of ADRB2 falls into "responds to cutting carbohydrates". Someone with Gly16 in ADRB2 or Arg64 in ADRB3, receptors involved in releasing fat from adipose tissue during exercise, falls into "responds less to moderate exercise". And anyone who meets no rule gets the default category: a balanced diet.
4. Settle clashes between rules with a priority. There is one case in which two rules point in different directions: a person with Glu27 in ADRB2, which points to carbohydrates, and with Thr54 in FABP2 and Pro/Pro in PPARG, which point to fat. The algorithm assigns "fat", because the evidence available for FABP2 and PPARG is greater than that for ADRB2 and carbohydrates. A rule-based algorithm always carries a hierarchy of evidence inside it, and it is worth knowing what it is.
5. Assign a cell and its recommendation. Three diet categories by two exercise categories give a matrix of six cells (figure 2). The table sets them out with the frequency given in the application, for people of European ancestry in a Quebec family study, and with what you can try in each one.
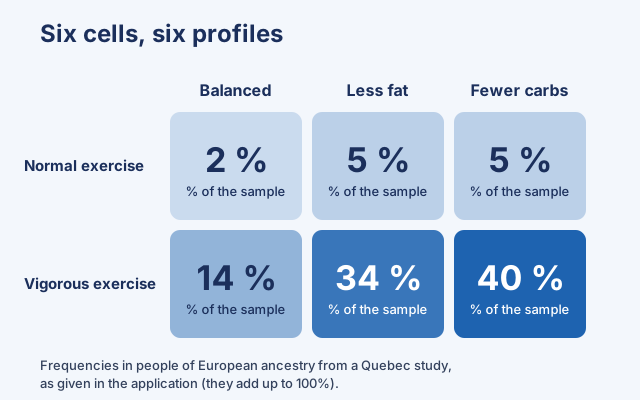
Genotype and diet: what the algorithm proposes
The right-hand column is a CESGEN proposal, derived from the text of the application and from the general guidance on a good-quality diet, to try and observe for a few weeks (weight, waist and, if you have blood tests, triglycerides). It is not the result of a validated study, and further down you will see why we frame it this way.
| Cell (frequency) | What the algorithm assigns | What you can try |
|---|---|---|
| Balanced, normal exercise (2%) | No particular leaning towards fats or carbohydrates; responds to moderate exercise. | A balanced diet with calories under control and regular moderate exercise; watch your weight and waist before adjusting anything. |
| Less fat, normal exercise (5%) | Cut fat; responds to moderate exercise. | Cut saturated fat and replace it with monounsaturated fat (olive oil, nuts); keep up regular moderate exercise. |
| Fewer carbohydrates, normal exercise (5%) | Cut carbohydrates; responds to moderate exercise. | Moderate refined carbohydrates (white bread, pastries, sugary drinks) and look after the quality of the fat; keep up regular moderate exercise. |
| Balanced, vigorous exercise (14%) | No particular leaning; responds less to moderate exercise. | A balanced diet with calories under control; raise the intensity gradually or add strength sessions, suited to your fitness. |
| Less fat, vigorous exercise (34%) | Cut fat; responds less to moderate exercise. | Combine the less-fat suggestion in the second row with the gradual rise in intensity in the fourth. |
| Fewer carbohydrates, vigorous exercise (40%) | Cut carbohydrates; responds less to moderate exercise. | Combine the fewer-carbohydrates suggestion in the third row with the gradual rise in intensity in the fourth. |
One figure helps with reading any report of this kind: adding up the three vigorous-exercise cells, 88% of that sample falls into them (a CESGEN calculation). When a category is very common, knowing you are in it tells you little; the information lies in the less usual categories.
How it was tested
The application includes an example with data. People assigned to four diets with different splits of fat and carbohydrate (Atkins, Ornish, LEARN and Zone) were separated by genotype into "suitable diet" and "unsuitable diet". On the low-carbohydrate diet there was no difference (p = 0.42). On the low-fat diets (Ornish and LEARN), the group with the "fat" genotype lost 4.6 kg on average over follow-up and the group with the "carbohydrate" genotype lost 2.4 kg (p = 0.007; 18 and 30 people). The application summarises the result as two to three times more weight loss on the diet suited to the genotype. The groups were small, from 6 to 30 people, and the document does not say which study the data come from.
Years later, a trial designed for this question put it to the test. DIETFITS (2018) randomly assigned 609 adults with overweight or obesity to a low-fat or a low-carbohydrate diet for 12 months, with sessions that stressed diet quality, and analysed patterns of three SNPs in the same three genes as the algorithm (PPARG rs1801282, ADRB2 rs1042714 and FABP2 rs1799883). Its starting point was a preliminary retrospective study that had seen a loss of 6 kg versus 2 kg depending on whether the diet matched the genetic pattern. In the trial, weight loss at 12 months was 5.3 kg on the low-fat diet and 6.0 kg on the low-carbohydrate diet, and there was no significant interaction between diet and genotype pattern (p = 0.20). The authors conclude that, for choosing between those two diets, the pattern did not help identify which suited each person better.
This does not invalidate the idea of using genetics to personalise: it says that, with these three SNPs and these two diets, the pattern was not enough. A large, well-designed trial is exactly what makes it possible to know, and it sets the standard for any genetic algorithm: test it in an independent group of sufficient size. That is why the proposal in the table is framed as something to try and observe, and not as a prescription.
From the rule-based algorithm to AI
The chain is the same in any system: genotype, score or category, recommendation. What changes is who decides the weights and how they are checked.
Rules written by people. This is the case of the application. Its advantage is that you can read every decision and see why it was made. It is also the logic of the decision trees in nutrition-advice systems such as the one in the Food4Me study, where the automated version matched the manual one in 87% of the advice messages (2016). Its limit is that thresholds and priorities depend on the judgement of whoever writes the rules, and combinations nobody has studied are settled by priority, not by data.
Weights learned from data. Machine learning estimates the weights from many people. A well-known example in nutrition, without genetics, is an algorithm trained on 800 people with continuous glucose monitoring that predicted the response to real meals; it was validated in 100 independent people and in a randomised trial (2015). Its advantage is that it finds combinations nobody wrote down. Its risk is overfitting, that is, learning the noise in the training data, and it is detected only with independent validation.
A language model that explains. A language model should not calculate your score; it can explain, in plain words, a score that was calculated outside it with a method that can be checked. It is the most prudent design: the calculation can be audited, and the model takes care of the communication.
All three share the question that matters, and DIETFITS answers it by example: it is not the complexity of the engine that gives a result credibility, but its having been tested in an independent group.
Towards the polygenic score
The step after rules with three or five variants is to add up the effect of many variants, each with its own weight. This is the polygenic risk score (PRS), an estimate of a person's genetic liability to a trait or disease, calculated from their genotype and from genome-wide association study data (a methods review, 2020). In nutrigenetics there is already a clinical practice guideline (2022) that considers applicable, in specific cases, a 31-SNP score to predict the response of triglycerides to omega-3 in adults with overweight or obesity. How a score is built, how it is validated and what its limits are we leave for the next entry.
If you have a genetic file
You can look for these five SNPs in your 23andMe or AncestryDNA file, on your own computer and by rsID; there is no need to upload the file to any online viewer. In the 23andMe files we checked, one of each version (v3, v4 and v5), rs1801282, rs1042713, rs1042714 and rs4994 appear, and rs1799883 (FABP2) does not. We have not checked AncestryDNA. Without FABP2 you cannot reproduce all the rules; DIETFITS imputed it statistically, with a high imputation quality (r² = 0.99).
The letters in the table are those of the forward strand of the reference genome, the one used by dbSNP; check the header of your file to see which strand it uses. Take care with FABP2 and ADRB3, because the application writes them with the letters of the opposite strand.
| Gene and SNP | Letters on the forward strand | What each letter means | How the application writes it |
|---|---|---|---|
| FABP2 rs1799883 (Ala54Thr) | C / T | C = alanine; T = threonine (Thr54) | G / A |
| PPARG rs1801282 (Pro12Ala) | C / G | C = proline; G = alanine | C / G |
| ADRB2 rs1042713 (Gly16Arg) | G / A | G = glycine; A = arginine | G / A |
| ADRB2 rs1042714 (Gln27Glu) | C / G | C = glutamine; G = glutamic acid | C / G |
| ADRB3 rs4994 (Trp64Arg) | A / G | A = tryptophan; G = arginine | T / C |
With your letters, follow the rules in step 3 to see which cell you would fall into, and read the proposal in that row of the table above. This information describes what has been observed in studies and does not replace the assessment of a healthcare professional.
What to bear in mind
- Frequencies depend on ancestry. Those in the table are for people of European ancestry in a Quebec study; the application itself records that the frequency of carriers of the Ala variant of PPARG ranges from 4% to 19% depending on the ancestry group it describes.
- The combinations come from single-variant studies. The application says that no study evaluated PPARG and ADRB2 together, which is why it combines them with rules and priorities.
- A patent application is not a study. It is a company document with the data it chose to present, without peer review.
- Introduce vigorous exercise gradually. If you have a medical condition or doubts about your fitness, check with your healthcare professional first.
CESGEN offers training and nutrigenomics panels; this entry explains a method and does not promote any test.
What you can do with this information
- When you read a genetic report, ask four questions: which variants are included, which rules or weights are applied, who decided the priorities and which trial tested it.
- If a report assigns you a diet because of your genotype, try it as a hypothesis. Give it a few weeks and watch your weight, your waist and, if you have blood tests, your triglycerides. The foundation, a good-quality diet you can keep up and regular exercise, works for any genotype.
- If your report leaves you in the balanced category, that is good news in practical terms: the general advice on healthy eating is your best starting point, and you can concentrate on making it sustainable.
That is how a genetic algorithm improves your eating: it does not give you a closed answer, but it teaches you what to ask and how to check what it tells you.
Sources
- Genetic Markers for Weight Management and Methods of Use Thereof (patent application US 2010/0136561 A1), United States Patent and Trademark Office (USPTO), published 3 June 2010. An application document, not a peer-reviewed study, 2010
- Effect of Low-Fat vs Low-Carbohydrate Diet on 12-Month Weight Loss in Overweight Adults and the Association With Genotype Pattern or Insulin Secretion: The DIETFITS Randomized Clinical Trial, Gardner CD et al. JAMA 319:667-679 (PMID 29466592), 2018
- A Dietary Feedback System for the Delivery of Consistent Personalized Dietary Advice in the Web-Based Multicenter Food4Me Study, Forster H et al. Journal of Medical Internet Research 18:e150 (PMID 27363307), 2016
- Personalized Nutrition by Prediction of Glycemic Responses, Zeevi D et al. Cell 163:1079-1094 (PMID 26590418), 2015
- Tutorial: a guide to performing polygenic risk score analyses, Choi SW, Mak TS-H, O'Reilly PF. Nature Protocols 15:2759-2772 (PMID 32709988), 2020
- Clinical Practice Guidelines Using GRADE and AGREE II for the Impact of Genetic Variants on Plasma Lipid/Lipoprotein/Apolipoprotein Responsiveness to Omega-3 Fatty Acids, Keathley J et al. Frontiers in Nutrition 8:768474 (PMID 35237638), 2022
- dbSNP: rs1799883, rs1801282, rs1042713, rs1042714 and rs4994 (forward-strand alleles and amino-acid change), accessed 9 November 2026, NCBI, National Library of Medicine, 2026
Educational content from CESGEN, based on the evidence published up to the review date. It does not replace individual medical or dietary advice: to apply it to your own case, talk it through with your health professional. Nutrigenetics is an evolving field, and we review each piece when the evidence changes.